PAX2GraphML allows to manipulate BioPAX data sources transformed as GRAPHML files.
Package sources
GRAPHML data banks
Quick start tutorials
Code documentation
PAX2GRAPHML is an open source python library that allows to easily manipulate BioPAX source files as regulated reaction graphs described in .graphml format. PAX2GRAPHML is highly flexible and allows generating graphs of regulated reactions from a single BioPAX source or by combining and filtering BioPAX sources. Supported by the graph exchange format .graphml, the large-scale graphs produced from one or more data sources can be further analyzed with PAX2GRAPHML or standard python and R graph libraries.
We show here a regulation network model in BIOPAX (A) and derivated formats (B,C). PAX2GRAPHML can produce and exploit a binary causality graph in GRAPHML format, for simple and efficient regulation network analysis.
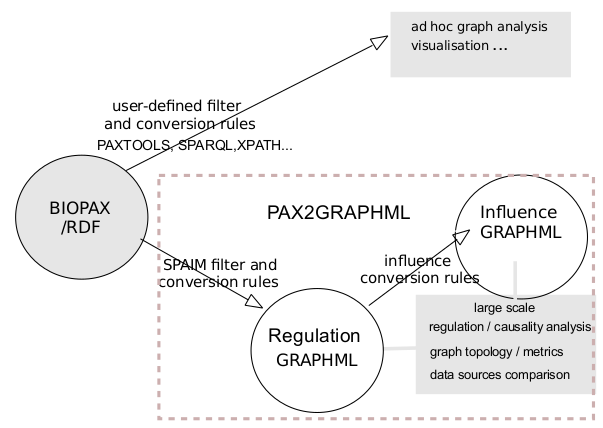
BIOPAX files are transformed to produce a regulation graph stored in GRAPHML. The reference data source remains BIOPAX but the graph analysis is managed in python using the extracted GRAHPML.
Try it with Jupyter notebook :
# example of quick deployment of PAX2GRAPHML
#and dependencies within Jupyter notebook


docker run -p 80:8888 -p 6006:6006 -it  \
  -e SHOW_PWD=true -e JUPYTER_PWD=password \
   fjrmore/pax2graphml  demo.sh

#then go to your browser at http://localhost
# password: password
# example of quick deployment of PAX2GRAPHML #and dependencies within Jupyter notebook docker run -p 80:8888 -p 6006:6006 -it \ -e SHOW_PWD=true -e JUPYTER_PWD=password \ fjrmore/pax2graphml demo.sh #then go to your browser at http://localhost # password: password